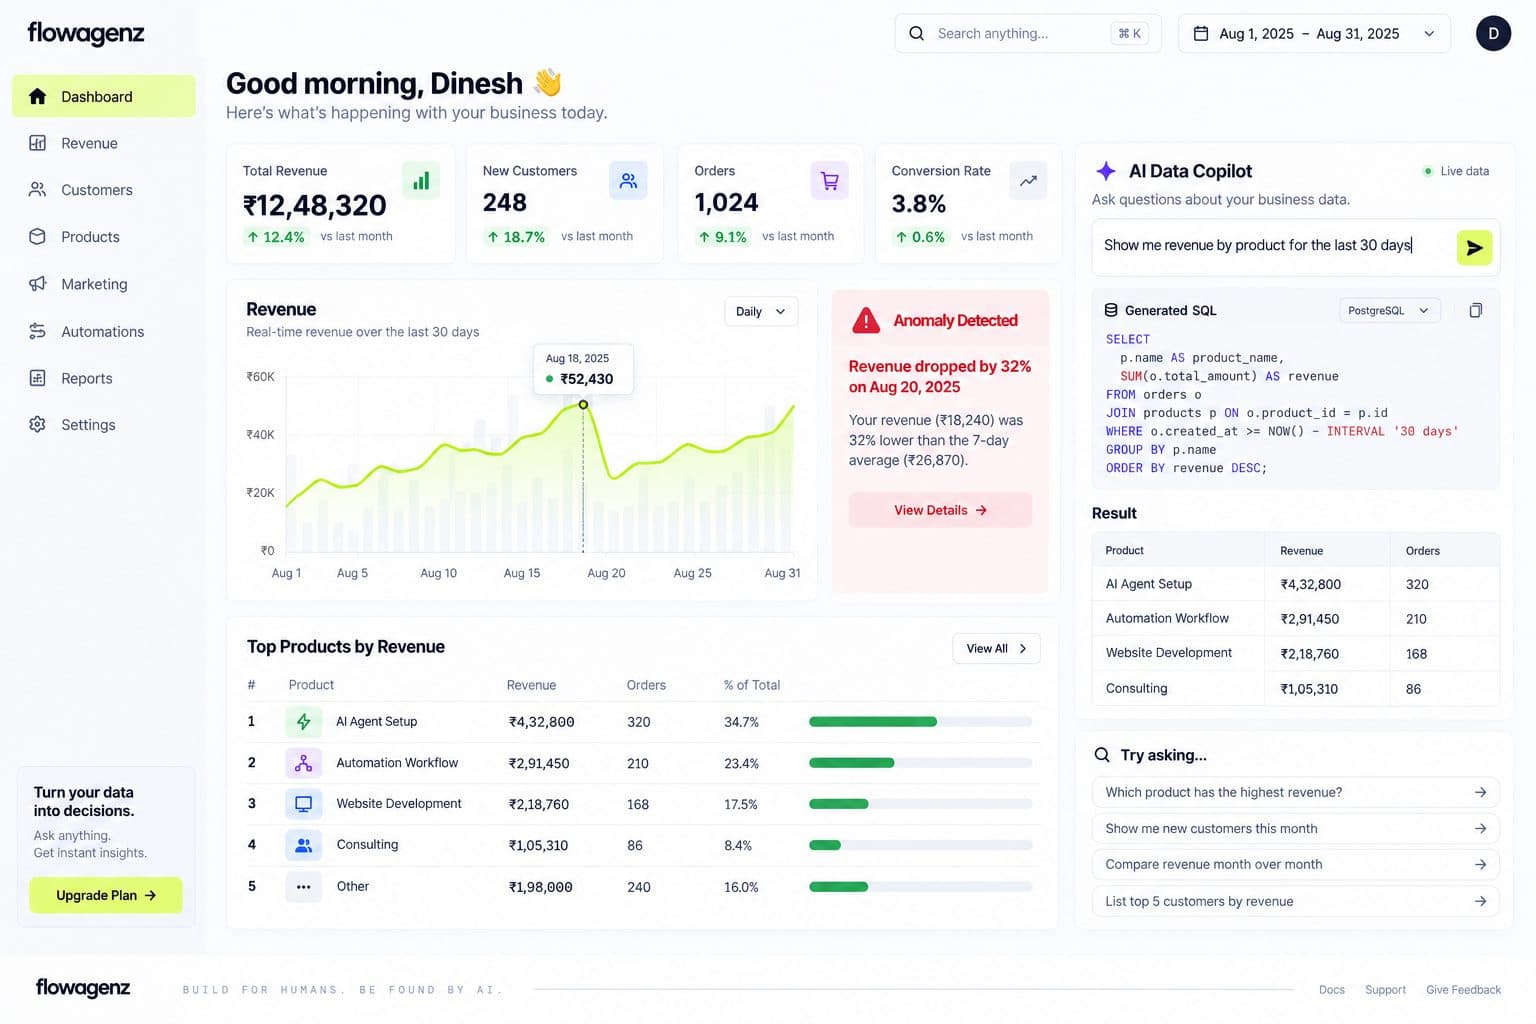
A dashboard your team actually opens instead of exporting to a spreadsheet for the real answer. Real-time charts on your actual schema, a natural-language query layer honest about where it works, and anomaly alerts tuned to your data, not a generic threshold.
Custom analytics dashboards, built on your own data
The problem, reframed
Most "AI-powered dashboard" products on the market are a chatbot wrapped around a CSV export, confidently answering questions against a stale snapshot of your data with no visibility into what query actually ran. That is a demo feature, not a reporting tool a business runs on.
I think natural language querying over your data is genuinely useful for exploratory questions from people who do not know SQL, and genuinely risky as the only way anyone checks a number that drives a decision. We build both: fast, correct charts for the metrics you check every day, and a natural language layer for the ad hoc questions, with the generated query always visible so nobody has to trust an answer they cannot verify.
What we build
01
Dashboard architecture matched to your data volume.
Live queries against your operational database work fine at moderate scale; past a point, dashboards querying a production Postgres instance directly start competing with the application for the same resources. We build materialized views or a dedicated read replica when your data volume calls for it, and say plainly when it does not, rather than over-engineering a dashboard for traffic you don't have.
02
Natural language to SQL, with the query shown.
A Claude API or OpenAI-backed query layer translates a plain-English question into SQL scoped to a defined, safe subset of your schema, never given write access, and the generated query displays alongside the answer so a user can catch a wrong interpretation before trusting the number. We tune this against your actual schema and test it with the ambiguous questions real users ask, not a clean demo dataset.
03
Real-time and near-real-time charting.
Recharts or D3 for the visualization layer, with WebSocket or polling-based updates for metrics that need to move live, and clear staleness indicators for anything on a longer refresh cycle so nobody mistakes a cached number for a live one.
04
Anomaly detection tuned to your baseline, not a fixed threshold.
A metric that normally swings 40 percent on Mondays needs a different alert threshold than one that is flat all week. We build detection against your actual historical variance rather than shipping a generic "alert if it moves more than X percent" rule that either fires constantly or misses everything.
05
Role-based access and export.
Different stakeholders see different slices of the same dashboard, with row-level or field-level restrictions enforced at the query layer, not just hidden in the UI. CSV and scheduled PDF export for anyone who still needs the number in a spreadsheet or a board deck.
Recently shipped
Built for a growing SaaS team first. We built an internal analytics dashboard for our own operations: real-time project metrics, automated weekly reporting that replaced a manual spreadsheet, and anomaly alerts on deployment frequency and client response times. The same team that built it uses it daily. We ship dashboards we would actually run our own business on.
Built on a modern, connected stack
Postgres with pgvector, Claude API and OpenAI, and self-hosted n8n are already core to how we build. A dashboard we ship for you can pull from a pipeline n8n already maintains, surface alerts through the same webhook infrastructure powering your other automations, and share the same Postgres instance your RAG chatbot queries if you have one, instead of standing up a parallel data stack that needs its own maintenance.
Who this is for
SaaS companies wanting embedded analytics inside their own product instead of sending customers to a third-party BI tool.
Operations teams drowning in manually assembled weekly reports who need a dashboard that answers the question before someone has to build a spreadsheet to find out.
Startups at MVP or early growth stage who need a real reporting layer without buying an enterprise BI platform priced for a company ten times their size.
Agencies needing white-label dashboard build capacity for a client's internal tooling or embedded analytics feature.
Why Flowagenz
Code and data infrastructure you own outright.
Full ownership of the dashboard code, the query layer, and any database views or pipelines built for it. No vendor lock-in, no per-seat BI platform fee replacing a one-time build cost.
Based in Salem, Tamil Nadu.
Western-grade engineering at a rate structure offshore delivery makes possible.
Real overlap, not vague promises.
Async-first communication with working hours that overlap US Eastern mornings, UK afternoons, and Australian business hours on the same day.
We say where AI features help and where they don't.
A natural language query layer is worth building when your users genuinely need ad hoc exploration; it is wasted engineering on a dashboard where five fixed charts already answer every question anyone asks. We scope based on your actual usage pattern, not on whichever feature sounds better in a sales conversation.
How it works
01
01
Metrics and access scoping.
We identify which metrics matter, who needs to see what, and whether your current database can serve dashboard queries directly or needs a materialized view or replica first.
02
02
Data layer build.
Views, indexes, or pipeline work to get the data into a shape the dashboard can query fast, without touching your application's production load path unnecessarily.
03
03
Dashboard and query layer build.
Charts, role-based access, and the natural language query layer if scoped in, tested against real questions from your team, not a demo dataset.
04
04
Handover and tuning.
A walkthrough with your team, anomaly thresholds tuned against real historical data rather than a default guess, and documentation for anyone extending the dashboard later. Typical builds run 3 to 6 weeks depending on data complexity and whether natural language querying is in scope.
What you get on handover
Every analytics dashboard ships with the following:
Full dashboard source code (Next.js frontend with Recharts or D3 visualization layer)
Query layer code including natural language to SQL module if scoped in
Database views and indexes built for fast dashboard queries without touching production load
Role-based access configuration enforced at the query layer, not just UI-level hiding
Anomaly detection rules tuned against your actual historical variance, not generic thresholds
Real-time and polling configuration with clear staleness indicators on every chart
Export functionality for CSV and scheduled PDF delivery
Webhook alert integration wired to your existing notification channels (Slack, email, etc.)
Documentation for adding new charts, metrics, or data sources without our involvement
30-day post-launch support for tuning thresholds, query performance, and user questions
Zero dependency on Flowagenz infrastructure; runs on your database, your servers, your control
FAQ
Frequently Asked Questions
Everything you need to know about our process and digital systems.
A typical analytics dashboard build runs INR 2,50,000 to 7,00,000 ($3,000 to $8,400) depending on data complexity, number of metrics and roles in scope, and whether natural language querying is included. A fixed-chart dashboard with 5 to 10 metrics and role-based access sits at the lower end. A multi-source data pipeline with real-time updates, natural language querying, and anomaly detection tuned to your baseline sits at the upper end. We scope on a call and quote in INR and USD together rather than a flat number that ignores your actual data shape, schema complexity, and whether your current database can handle dashboard queries directly or needs a read replica first.
Book your analytics dashboard scoping call
Tell us which metrics matter most and how your team is tracking them today; spreadsheet, generic BI tool, or nothing consistent. We scope the data layer, the dashboard architecture, and the build cost on a short call. No generic pitch.